OVERVIEW
Big Data drives most modern business, and big data never sleeps. Often as a part of organisation’s data strategy, they might have to undertake data migrations to replace their legacy systems to improve performance, move IT infrastructure to the Cloud or consolidate their IT landscape into single system. A strong testing framework should be in place to ensure the accuracy of the implementation and completeness of the application. This case study is about a solution we have implemented for one of our clients to identify the gaps/mismatches in data between legacy and modern implementations.
Business Problem Statement
Enterprise client was implementing the MS Dynamics and loading the sales opportunities and CRM data from their existing legacy system to MS Dynamics. During the data migration process to MS Dynamics, they had the significant $ opportunity value differences for each quarter. However, data migration team and/or business was unable to track the opportunities which were causing the differences and unable to fix them to match the $ values in both the systems.
Challenge
Data migration team implemented a database solution which is to pull the data from both MS Dynamics and Legacy systems into SQL Server through SSIS packages and processes the data by running stored procedures to identify the differences at opportunity level and extract them into excel sheets for discussion with business owners. This whole process was manual and was taking approximately 8 to 16 man hours. This was not an automated and a scalable solution, due to manual effort involved in the process business had to wait for at least a week to see the results.
Automated Solution
Provided the automated solution by building the data reconciliation dashboard which clearly shows the overall summary of # opportunities and $ opportunity value differences from both legacy system and MS Dynamics sources. Further identified the possible reasons for mismatches and aligned the opportunities accordingly which has been used to discuss with data migration team and business stakeholders on those specific opportunities to take necessary actions if any.
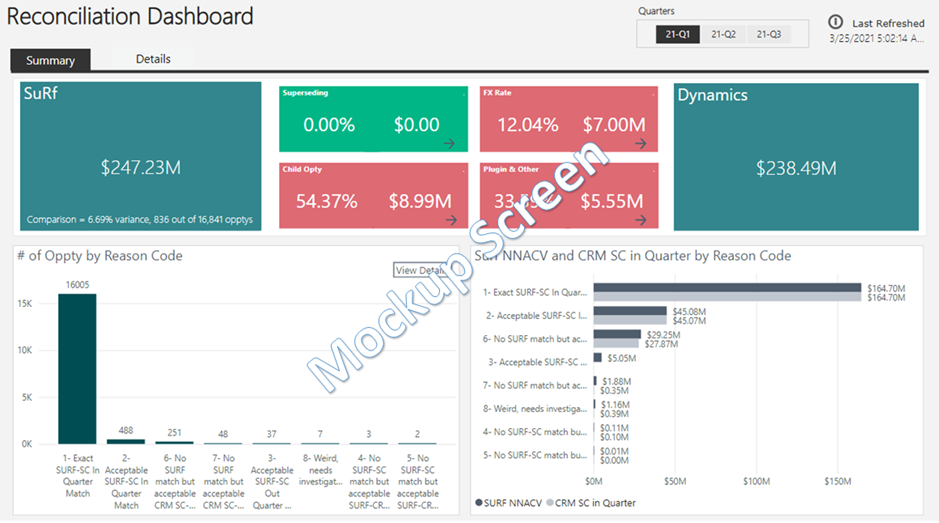
- Presentation layer created in such a way that they clearly understand the summary of # of opportunities and $ opportunity value differences for each category and for each quarter
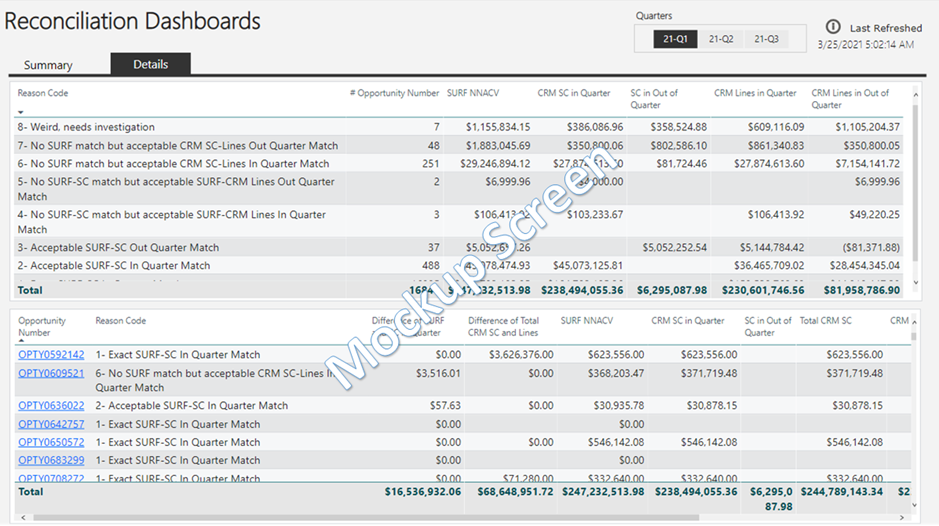
- Enabled the drill down capability so that the user can easily identify the list of opportunities which are causing the differences for each category and for each quarter.
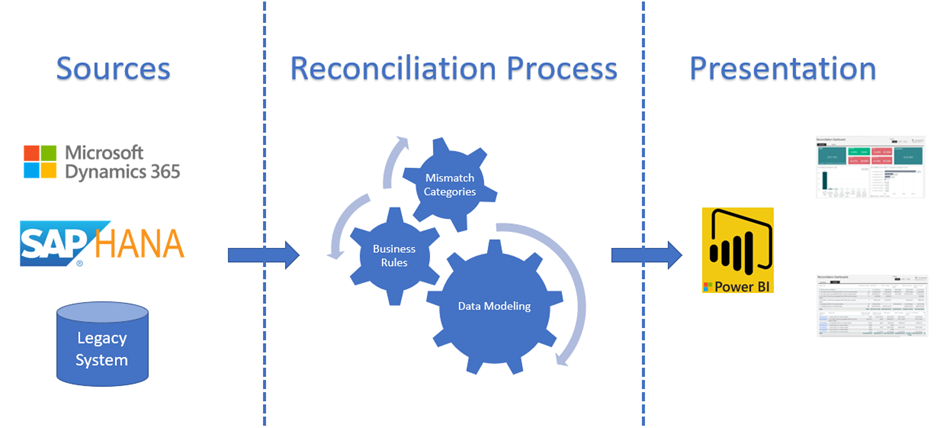
Solution Architecture Diagram
solution Mockup screenshots
Business outcome / Benefits
This dashboard had been scheduled to refresh the processed reconciliation data once a day which saved a lot of manual efforts of data migration team and helped them in finding the root cause of the data mismatch and provide logical fixes wherever necessary.
Adoption of the solution
This automated solution has been widely accepted across the data migration and business teams to find out the actual opportunities which are causing the differences in $ value. It was part of their daily routine to check the dashboard summary of differences and related opportunity details to discuss and take required actions to fix the issue.
Please write to us at connect@ngenux.com to have some exciting conversations around data related technologies like Data Engineering, Data Science, Machine learning, Artificial Intelligence, Business Intelligence and Visualization.