
Data observability is a watershed moment for all of your future Data Operations, Data Quality frameworks, and Data Governance strategies that are nice to have ideology but are now actionable, thanks to advances in this category.
It is crucial to comprehend the wealth and health of the data in your system, and it can manage data health across various IT technologies and across the data lifetime.
Bad data squanders time and resources, erodes trust in the data, and results in lost or unrealized income.
Observability will only deal with transactions between the applications. It can be used to identify the impact using below three key areas.
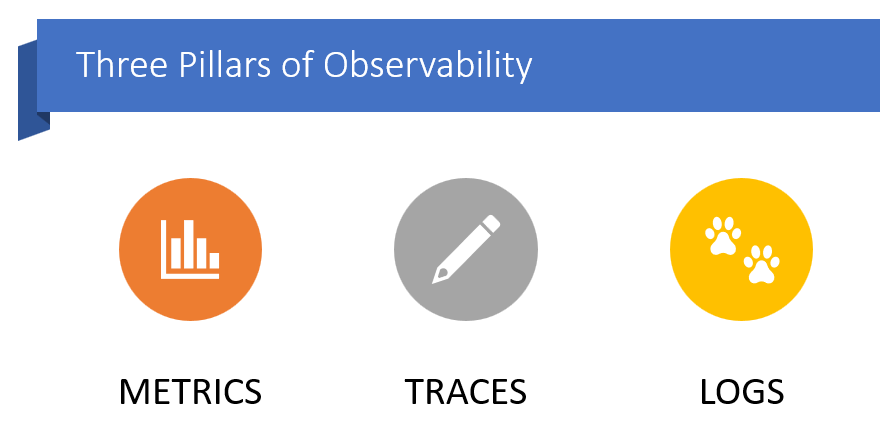
Metrics are quantitative statistics that show the functionality and performance of infrastructure or software. For instance, application metrics may track the number of transactions an application processes every second, whereas infrastructure metrics track the amount of CPU or memory used by a server.
Traces are intended to capture a sequence of scattered events as well as the interstices between them. Distributed traces keep track of a user’s interactions with an application or travel through a process, then collect that information from other servers. An end-to-end trace displays user queries, backend systems, and handled requests.
Logs are files that keep track of incidents, alerts, and mistakes as they happen in a software system. The majority of logs contain contextual data, such the time an incident happened and the user or endpoint it was related to.
If just 10% of Fortune 1000 firms improved the usability of their data, total revenue would increase by $2.01 billion per year.
-Gartner
Data Observability
Data Observability comes into play when delving deeply into data. It is a subset of Observability, focused on monitoring and managing databases and data warehouses and it is an end-to-end approach to enable teams to deliver more reliable and trustworthy data.
As a result, it centres on monitoring, testing, lineage, provenance, risk identification, and mitigation, as well as enabling the delivery of the best data quality and consistency, making all related metadata easily consumable by all interested parties via simple-to-use APIs or web UIs that can respond to questions like…
- Is your pipeline executing?
- Was the data is in Expected format?
- How fast the data is moving?
- Was the loaded data as expected?
- When it was loaded?
- What is the quality level (no record row, a value was expected) of loaded data?
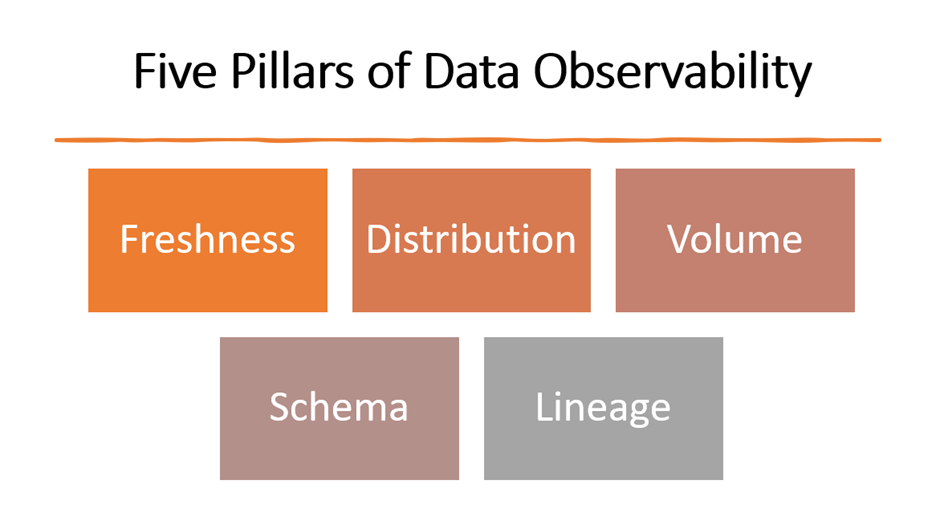
There are 5 pillars to accomplish this
- Freshness
- Distribution
- Volume
- Schema
- Lineage
Freshness
Freshness measures the frequency of updates to your data tables as well as how recent they are. It is especially important when making decisions because outdated information is essentially synonymous with time and money wasted.
Distribution
The distribution of your data’s potential values tells you whether your data falls inside a range that is acceptable. Data distribution enables you to determine whether your tables can be trusted based on the data you have.
Volume
Your data tables’ size provides insight into their completeness and the state of your data sources. If the number of rows decreases from 50 million to 3 million, this is an alarming situation.
Schema
Changes in how your data is organized or schema are typically indicators of broken data. If you want to know how well your data environment is functioning, it’s essential to keep a track of who and when these tables are being adjusted.
Lineage
Data lineage reveals the teams that are producing the data and who is accessing it, as well as whose upstream sources and downstream users were impacted. As a single source of truth for all users, good lineage also collects metadata that relates to governance, business, and technical rules for data tables.
Capabilities of Data Observability tools
Data Observability tools will take a metadata approach to know where the data is coming from, where it is landing, and to detect the issues at this place.

Monitoring involves checking the accuracy and completeness of the information entered into the database. To make sure if the entered data will achieve the objectives of the registry or clinical trial, the data can also be evaluated.

Alerting refers to a monitoring system’s ability to detect and notify operators of significant events that indicate a serious change in the state.

Tracing is the practise of documenting the stages or occurrences in a process or system, usually with the aim of troubleshooting, performance analysis, or understanding behaviour. It may also be used to describe the process of reproducing an image or design by duplicating it onto another surface.

Comparison: A comparative observational study’s goal is to ascertain whether measurements between tables from various schemas differ.

Analysis: Automate detection issues that adopts your data and provide a brief overview of Activity monitor, DB locks, Throughputs, and Resource utilization across the database.

Logging: In order to monitor, debug, or conduct an audit, logging is the process of recording events or messages to a log file or database. Logs may be used for troubleshooting, auditing, and analysis and can contain data on user activity, system performance, failures, and other events.

SLAs Tracking: Ability to measure Data Quality in Data pipeline against pre–defined standards. Service-level agreements (SLAs) are a technique that many businesses employ to specify and gauge the quality of service that a particular vendor, item, or internal team will provide as well as possible remedies if they don’t.
Rules for Monitoring
Out of all the functionalities that Data Observability Tools does, Monitoring plays a key role, and it requires a lot of efforts. With the below rules Data Observability aims to bring Stability and Reliability to Data products.
Data at REST:
- Is the data arriving on time?
- Is data being updated frequently as needed as to be…
- Is this expected Volume of data, is it complete?
- Is it available to use?
- Are there any schema changes?
Data in MOTION:
- Monitor the pipeline performance like State, Duration, Delay, Retries
- What operations are transforming the data set before it reaches the warehouse
- Are there any unexpected changes in the execution of metadata
Column Profile:
- What is the expected Range for column data
- What is the expected schema
- How Unique is the column
- Tracking Trends with Means, min, max, Skewness, Kurtosis and Z-Score
Row Profile:
- Values in the row level are in expected format
- Are the values length expected to be
- Is there enough information useful to the end user
- Check for any Business rules
In conclusion, data observability is a crucial aspect of data management that enables organizations to monitor and understand the data that is flowing through their systems. With the increasing importance of data in today’s digital world, data observability will likely become even more important in the future. Organizations that prioritize data observability and invest in the necessary tools and resources will be well-positioned to succeed in the data-driven economy.
Get in touch with us today at connect@ngenux.com to know more about how we help organizations to optimize their systems, improve security, and make informed, data-driven decisions.