
Business intelligence (BI) tools have become essential in today’s data-driven world, providing organizations with the ability to analyze, visualize, and derive insights from vast amounts of data. With a plethora of BI tools available in the market, it’s crucial to understand and compare the best BI tools before making the right selection for any organisation. In this in-depth analysis, we will delve into the features, capabilities, and advantages of the top 5 BI tools, providing a comprehensive overview of their strengths and limitations. Whether you’re a business owner, analyst, or data professional, this analysis will help you gain insights into the leading BI tools and determine which one may best suit your organization’s needs.
What we will cover in this blog:
- Introduction to Business Intelligence (BI)
- In-depth Review of top 5 trending BI tools
- Overall ease-of-use
- BI Features: pros & cons
- Price
What is Business Intelligence (BI)?
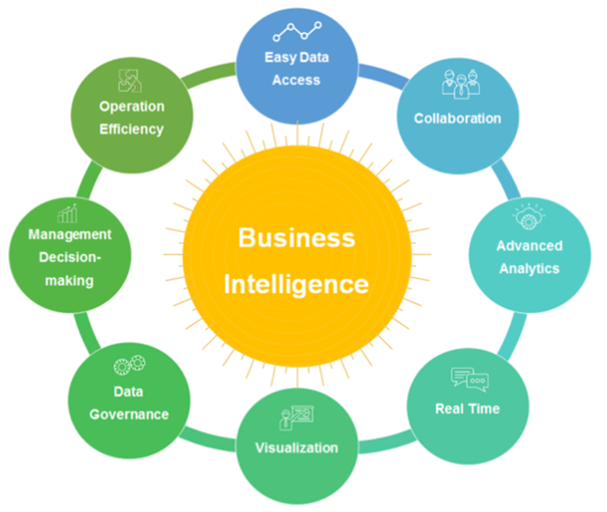
Business Intelligence (BI) refers to the process of gathering, analysing, and visualizing data to help businesses make more informed decisions. BI involves the use of software tools and techniques to collect data from various sources, such as transactional systems, customer databases, and social media, and transform it into meaningful and actionable insights.
The goal of BI is to help organizations better understand their business processes, identify patterns and trends, and make data-driven decisions to improve efficiency, productivity, and profitability. BI typically involves the use of dashboards, reports, and data visualization tools to help users quickly and easily understand and analyse data.
BI can be used in various industries, including healthcare, finance, retail, and manufacturing, to gain insights into customer behaviour, market trends, product performance, and operational efficiency. BI also plays a crucial role in strategic planning and decision-making, helping businesses stay competitive and adapt to changing market conditions.
In this article, we have compared the top 5 BI tools on the overall ease-of-use, BI features, and the price. In the end, after comparison, you will see which software is best suited for the needs of you and your company.
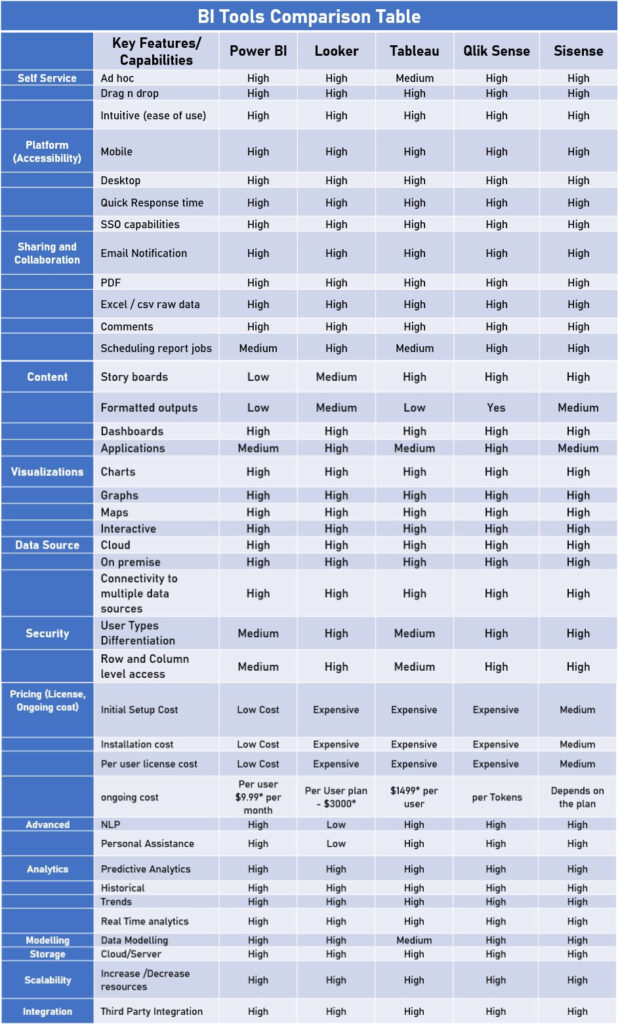
*High – Fully supported, Medium – Feature with limitations, Low – Evolving feature
Power BI In-depth Review:
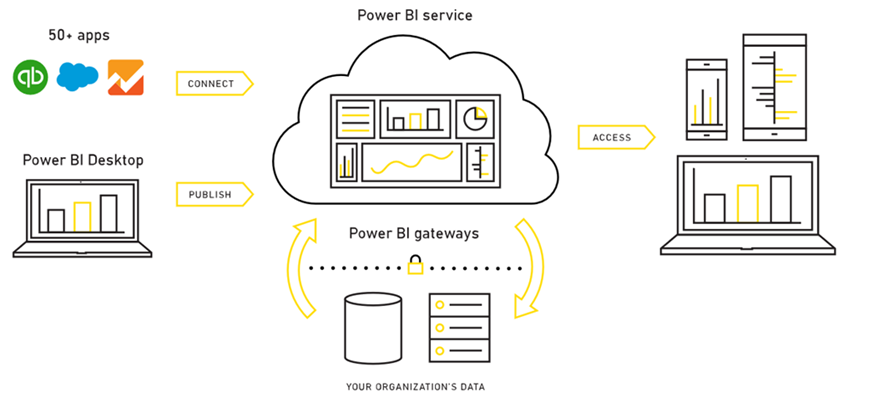
Power BI is a business analytics service developed by Microsoft that provides interactive visualizations and business intelligence capabilities with an interface simple enough for end users to create their own reports and dashboards. It allows users to connect to a wide variety of data sources, including spreadsheets, databases, and cloud-based services, and create interactive visualizations and reports that can be shared across an organization.
1. Overall ease-of-use
Since it is a BI tool developed by Microsoft, basically Excel pivot tables with Excel’s data visualization tools taken to the next level, the UI of PowerBI is similar to Excel, and it allows for a short learning curve. It also provides detailed learning videos and documents for further learning.
2. BI Features: Pros & Cons
Pros:
- Integrates well with other Microsoft tools, such as Excel and SharePoint.
- Allows for easy sharing and collaboration on reports and dashboards.
- Offers strong data modelling and ETL capabilities.
- Offers a large number of pre-built visualizations and templates.
- Offers a user-friendly interface and is easy to learn for non-technical users.
- Offers a range of deployment options, including on-premises and cloud-based solutions.
Cons:
- Limited advanced analytics capabilities compared to some of the other tools.
- Limited ability to customize visualizations compared to other tools.
- Dashboard response may be slow when working with large volume datasets.
- The free version has limited functionality and features.
- Can be difficult to collaborate with team members who don’t have PowerBI licenses.
- Limited support for non-Microsoft data sources.
3. Price
If you have a small budget and you are looking for an affordable option to go for, the Power BI is the product you will be ending up with. Cost for the Pro version is available at $9.99*/user/month, which is lower than similar products in its niche.
Looker In-depth Review:
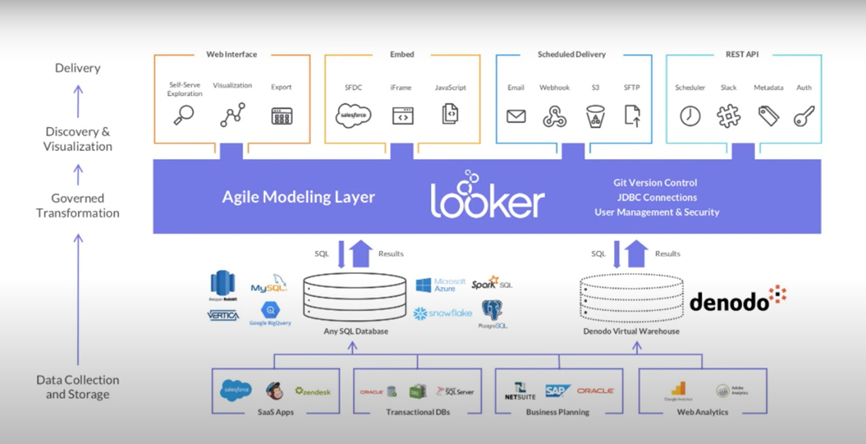
Looker is an innovative BI with a unique approach to business intelligence. Looker has its own proprietary modelling language called LookML, it also provides a data modelling layer that is both reusable and maintainable and a wide range of visualization options. Looker also offers various data tools that can help you get the most out of your analysis including ML models that can be deployed in your dataset. For instance, there are BigQuery ML models available within the Looker Marketplace including classification, regression and time series forecasting models.
1. Overall ease-of-use:
Looker has an intuitive interface that makes it easy for users to navigate and access the tool’s features. Looker provides a drag-and-drop functionality that makes it easy to create custom reports and visualizations. Looker’s interactive dashboards allow users to explore data and gain insights in real-time.
2. BI Features: Pros & Cons
Pros:
- Offers a web-based interface that can be accessed from anywhere.
- Offers a flexible and customizable platform that can be tailored to specific business needs.
- Provides a unified view of data from multiple sources.
- Offers advanced analytics capabilities, such as predictive modeling and machine learning.
- Provides powerful data visualization capabilities.
- Offers a range of deployment options, including on-premises and cloud-based solutions.
Cons:
- Initial setup and configuration can be complex and time-consuming.
- Can be expensive, especially for smaller organizations.
- Learning curve will be long for non-technical users.
- Limited support for non-relational databases.
- Dashboard response may be slow when working with large volume datasets.
- Limited customization options for visualizations.
3. Price
Starts approximately at $35,000*/year (~$2900*/month).
Tableau In-depth Review:
Tableau is a trendy BI tool that many businesses are embracing, and it is unique for its aesthetics and design powered by Pixar artists.
Being around for more than 16 years, Tableau stands out for the user experience it offers to users. Even beginners will not have a frustrating first experience using it.
1. Overall ease-of-use:
The tool’s intuitive manner of creating graphics and a user-friendly interface enable lay users to utilize the basic app’s functionality to the fullest. When designing a dashboard, you need to create a worksheet and then drag it to the container. For first-time users, it takes time to get used to it.
However, in-general, non-technical users can enjoy the stats parsing capabilities without in-depth training. For more profound knowledge to get into the solution’s capabilities, the Tableau community is an excellent place to go since Tableau’s fans invest their expertise and skills into the community increases steadily, and they are willing to help settle any user issues and to share their experience.
2. BI Features: pros & cons
Pros:
- Offers a wide range of powerful and interactive visualizations.
- Allows for easy data exploration and analysis with drag-and-drop functionality.
- Offers a user-friendly interface that is easy to learn for non-technical users.
- Provides strong support for real-time data streams.
- Offers a large community of users who share tips, tricks, and best practices.
- Offers a range of deployment options, including on-premises and cloud-based solutions.
Cons:
- Can be expensive, especially for small businesses.
- Dashboard response may be slow when working with large volume datasets.
- The software has a steeper learning curve compared to some of the other tools.
- Limited support for real-time data streams.
- Limited ability to manage data security and access controls.
- Limited native data preparation capabilities.
3. Price
The price is based on the number of users. Considering that the cost of a license is quite high for most small to medium companies, Tableau is primary the choice of large enterprises.
QlikSense In-depth Review:
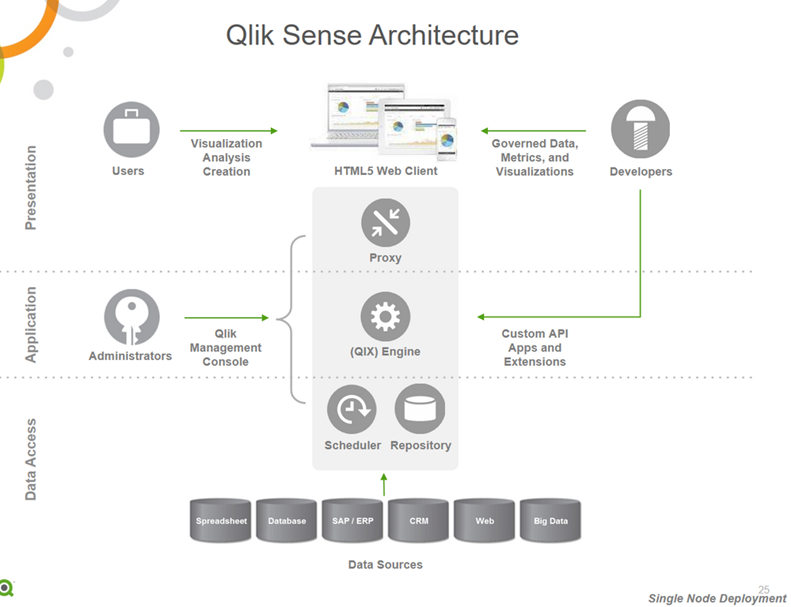
Qlik Sense is a data visualization and business intelligence software developed by Qlik. It allows users to easily create interactive dashboards and reports from various data sources, and provides powerful data analysis and exploration capabilities. Qlik Sense features a drag-and-drop interface and a variety of visualizations, such as bar charts, pie charts, and heat maps, that can be easily customized to fit the user’s needs. The software also has powerful search capabilities and can perform complex calculations and data modeling. Qlik Sense can be deployed on-premises or in the cloud, and can be accessed from desktops, tablets, and smartphones.
1. Overall ease-of-use
Qlik Sense has a user-friendly and intuitive interface, which makes it easy to use for most users. The software features a drag-and-drop interface, which allows users to quickly create visualizations and dashboards without requiring any coding or programming knowledge. The interface is also highly customizable, allowing users to tailor the software to their specific needs.
One of the unique features of Qlik Sense is its associative engine, which automatically links data and allows users to explore it in any direction. This makes it easy for users to analyze data and make new discoveries. The software also features natural language search, which allows users to type in a question or keyword and get instant results.
Overall, Qlik Sense is designed to be intuitive and easy to use, with a focus on empowering users to explore data and gain insights without requiring technical expertise.
2. BI Features: Pros and Cons
Pros:
- Offers a user-friendly interface and is easy to learn for non-technical users.
- Provides strong data visualization capabilities, including drag-and-drop functionality.
- Allows for easy sharing and collaboration on reports and dashboards.
- Offers strong data modelling and ETL capabilities.
- Provides powerful data exploration and analysis capabilities.
- Offers a range of deployment options, including on-premises and cloud-based solutions.
Cons:
- Limited ability to customize visualizations compared to some of the other tools.
- Limited advanced analytics capabilities compared to some of the other tools.
- The software can be resource-intensive and may require significant hardware upgrades.
- Limited support for real-time data streams.
- It can be difficult to integrate with other tools and applications.
- Limited support for non-Qlik data sources.
3. Price:
Qlik Sense Business – for individuals and teams: $30*/user per month, billed annually.
Qlik Sense Enterprise – for larger organizations: Contact Qlik for Enterprise pricing.
Sisense In-depth Review:
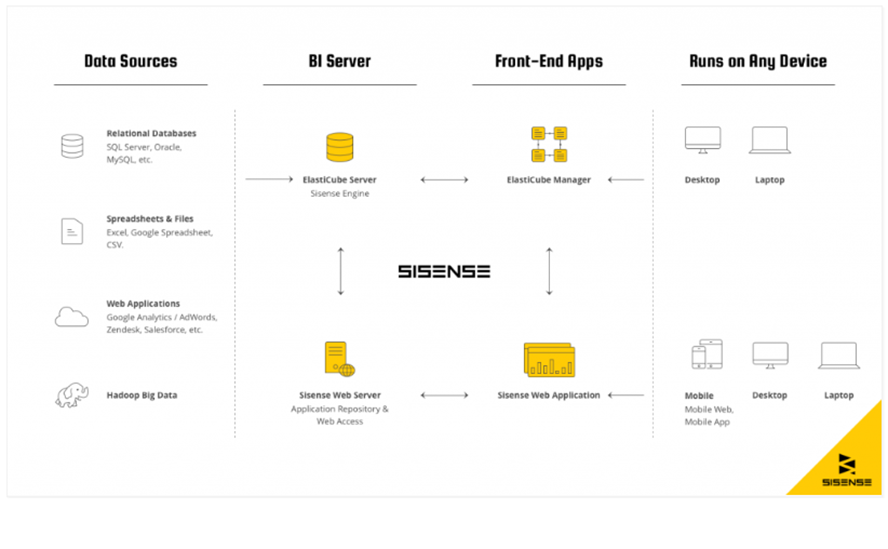
Sisense is an enterprise-grade analytics platform. It takes pride in going beyond traditional business intelligence to provide organizations with the ability to infuse analytics everywhere, embedded in both customer and employee applications and workflows.
1. Overall ease-of-use
Like other market leaders of BI tools, the interface is intuitive that users can operate via drag-and-drop. Sisense also has an online community. Although users of Sisense’s community are less active than Tableau’s, the resources in that community are enough for newbies for deep learning.
2. BI features: Pros & Cons
Pros:
- Offers a powerful and flexible data modelling engine.
- Provides a unified view of data from multiple sources.
- Offers advanced analytics capabilities, including predictive modelling and machine learning.
- Allows for easy sharing and collaboration on reports and dashboards.
- Offers strong data visualization capabilities, including the ability to create custom visualizations.
- Offers a range of deployment options, including on-premises and cloud-based solutions.
Cons:
- Can be expensive, especially for smaller businesses.
- Initial setup and configuration can be challenging sometimes.
- Limited documentation and resources compared to some of the other tools.
- Limited ability to manage data security and access controls.
- Dashboard response may be slow when working with complex data models.
- Limited support for non-Sisense data sources.
3. Price
Provide the free trial, the full version price is quote-based and need to contact vendors.
Final verdict:
Determining which tool is the best among PowerBI, Looker, Tableau, QlikSense, and Sisense depends on various factors, including your specific business needs, the size of your organization, and your budget. Each tool has its strengths and weaknesses and offers different features and capabilities.
For instance, PowerBI offers strong integration with other Microsoft tools and a user-friendly interface, while Looker offers advanced analytics capabilities and a flexible, customizable platform. Tableau provides a wide range of powerful and interactive visualizations, QlikSense offers strong data visualization capabilities, and Sisense offers a powerful and flexible data modelling engine.
We at Ngenux, along with our strong team of BI experts are dedicated to helping clients choose the right tool for their business needs. By providing personalized support and guidance, we ensure that our clients get the most out of their BI investment and achieve their business objectives. Whether you’re a small business or a large enterprise, the BI team at Ngenux can help you navigate the complex world of data analytics and select the best BI tool for your organization. Don’t hesitate to reach out to us at connect@ngenux.com and take advantage of our expertise to unlock the full potential of your data today!