
Marketing Analytics is an ever evolving with new technologies emerging every day. With so much data available at our fingertips, it can be overwhelming to figure out how to harness it all to drive business success. In this blog post, we have explored the world of marketing analytics, covering the essential KPIs that businesses use to turn data into valuable insights. With the ability to provide valuable analytics insights to employees at all levels of an organization, marketing analytics is a crucial tool for driving business success. We hope this post provides you with a solid foundation in marketing analytics and how it can benefit your organization.
Decoding the Significance of Marketing Analytics: Unveiling Its Crucial Role
Marketing analytics is a crucial process that involves collecting, measuring, analyzing, and interpreting data related to marketing activities. It enables businesses to gain insights into the effectiveness of their marketing strategies and tactics and make informed decisions to optimize their marketing efforts. The significance of marketing analytics is steadily on the rise as the volume of data generated by marketing activities continues to grow, and businesses strive to gain a competitive edge by leveraging data-driven insights.
Campaigns:
Campaigns are an essential marketing tool used by businesses of all sizes and industries to promote their products or services, generate leads, and increase brand awareness.
Deciphering Campaign Effectiveness: The Pivotal Art of Choosing the Right Strategy
One of the key factors in running a successful campaign is choosing the right type of campaign for your goals. Different types of campaigns have different objectives and strategies, and targeting the wrong audience or using the wrong tactics can lead to poor performance and wasted resources. Before starting a campaign, it is important to define clear goals, understand your target audience, and select the most appropriate campaign type based on these factors.
Tips for running a successful campaign: Once you have decided on the type of campaign to run, there are some key strategies that can help maximize its effectiveness. These may include setting clear and measurable goals, defining your target audience and messaging, creating compelling and engaging content, selecting the most appropriate channels for distribution, testing, and optimizing your campaigns over time, and measuring and analysing the results to improve future campaigns.
Types of campaigns: As we discussed earlier, there are many types of campaigns, including awareness, lead generation, product launch, seasonal, rebranding, public relations, advocacy/political, employer branding, and community outreach campaigns. Each type of campaign is designed to achieve specific goals, such as building brand awareness, generating leads, or promoting a new product. Choosing the right type of campaign will depend on your specific business objectives and target audience.
Key metrics for measuring campaign success: Finally, it is important to track and measure the success of your campaigns to understand what is working and what is not. Some key metrics to consider include reach, engagement, conversion rate, cost per acquisition, and return on investment. By regularly analysing these metrics, you can make data-driven decisions to improve your campaigns and achieve your business objectives more effectively.
Data Capturing
To conduct marketing analytics, it is essential for organizations to collect and analyze different types of data including customer demographics, website traffic, social media engagement, email marketing metrics, sales data, and advertising campaign performance. Through the examination of this data, businesses can obtain valuable insights into customer behavioral, preferences, and needs, as well as the efficiency of their marketing initiatives. This empowers them to make informed decisions based on data and refine their marketing strategies to achieve more favorable business results.
Process of data capturing in marketing analytics.
The process of data capturing in marketing analytics typically involves the collection and storage of various types of data that are relevant to understanding customer behaviour and the effectiveness of marketing activities.
There are several ways to capture data for marketing analytics, including:
- Website analytics: Tools like Google Analytics and Adobe Analytics allow businesses to track website traffic, user behaviour, and conversion rates.
- Social media monitoring: Platforms like Hootsuite and Sprout Social can capture data on social media engagement, including likes, shares, comments, and mentions.
- Email marketing metrics: Email marketing software like Mailchimp and Constant Contact can capture data on open rates, click-through rates, and subscriber behaviour.
- Sales data: CRM systems like Salesforce can capture data on customer interactions, sales revenue, and pipeline activity.
- Advertising campaign performance: Ad platforms like Google Ads and Facebook Ads Manager can capture data on ad impressions, clicks, and conversions.
Importance of data quality and accuracy.
it is crucial to ensure that the data being captured is of high quality and accuracy. This is because the insights and decisions derived from this data can have a significant impact on a business’s marketing strategy and overall success. Poor quality or inaccurate data can lead to flawed analyses and misguided decisions, potentially wasting valuable resources and negatively impacting business outcomes. Therefore, businesses should prioritize data quality and accuracy by implementing data validation and cleansing processes, leveraging advanced data analytics tools, and ensuring proper data governance practices are in place. By doing so, businesses can have confidence in the insights and decisions they make based on their marketing analytics data.
Data Consolidation & Classification
Data consolidation involves merging data from various sources into a single dataset to gain a comprehensive view of the business. This can include data from customer databases, website analytics tools, social media platforms, and more.
Once the data is consolidated, it needs to be classified into relevant categories for analysis. This involves grouping the data into meaningful segments based on various criteria, such as customer demographics, buying behaviour, or marketing channels. Classification allows businesses to identify patterns, trends, and insights in their data that can inform their marketing strategies and decision-making.
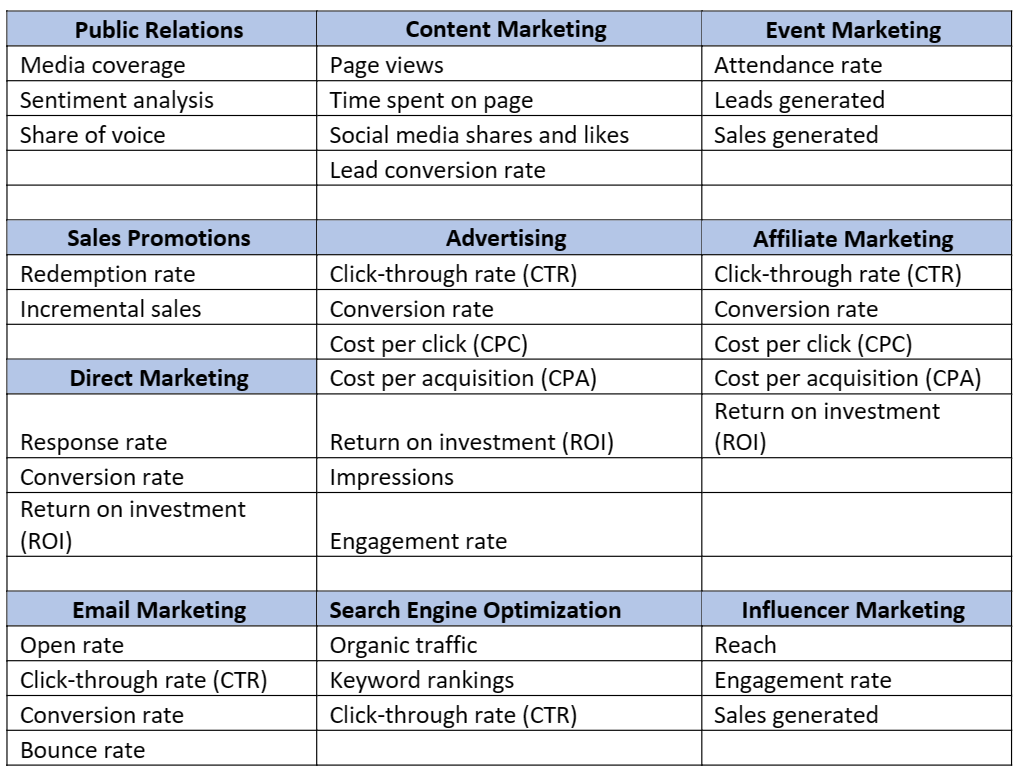
Below are the KPI’s related for different types of Marketing Campaigns.
Problem Statement:
Our Client is investing significantly in marketing efforts, including SEO and Google Ads, yet witnessing a limited influx of leads and conversions. Despite the substantial budget allocation, there is a noticeable gap between the marketing spend and the desired outcomes. The challenge is to optimize the marketing strategy, ensuring it effectively targets the right audience and translates into increased leads and conversions.
Steps Taken for Value Creation:
Thorough Data Analysis:
Conducted a deep dive into existing data, scrutinizing user behavior, website traffic, and conversion patterns. Identified trends, bottlenecks, and areas requiring improvement.
Audience Segmentation:
Leveraged advanced analytics tools to segment the target audience based on demographics, online behavior, and engagement metrics. This facilitated a nuanced understanding of diverse customer needs.
Optimizing Keywords and Ad Performance:
Revamped the SEO strategy by optimizing keywords for relevance. Conducted a meticulous audit of Google Ads campaigns, refining bids, ad creatives, and targeting parameters for maximum visibility among the target audience.
Enhancing Conversion Funnel:
Analyzed the customer journey, identifying potential friction points, and optimized the conversion funnel to streamline user experience, fostering improved lead generation.
A/B Testing Implementation:
Deployed A/B testing methodologies to experiment with ad copies, landing page designs, and call-to-action elements. Evaluated performance to identify the most effective combinations for driving conversions.
Leveraging Remarketing Strategies:
Implemented targeted remarketing campaigns to re-engage users showing initial interest but not converting. Created personalized ads based on their previous interactions with the website.
Integration of Marketing Analytics KPIs:
Established tailored key performance indicators (KPIs) aligned with business goals, such as click-through rates, conversion rates, and cost per acquisition. Regularly monitored and analyzed these metrics for gauging the effectiveness of the optimized marketing strategy.
Continuous Monitoring and Iteration:
Instituted a system for ongoing monitoring of marketing performance. Regularly reviewed analytics data, user feedback, and market trends to make iterative adjustments, ensuring sustained optimization.
Stakeholder Education:
Conducted internal training sessions to enlighten stakeholders on the significance of data-driven decision-making and the impact of the refined marketing strategy on business outcomes.
Performance Reporting and Communication:
Developed comprehensive reports showcasing improvements in lead generation and conversions. Maintained open communication with stakeholders, offering regular updates on the success of the implemented strategies.
Through a comprehensive approach and the utilization of data-driven insights, the company successfully transformed its marketing efforts, witnessing a substantial increase in leads and conversions and maximizing the return on marketing investment.
Customized Analytics for Diverse Employee Levels:
We have implemented a unique way of providing customized analytics for people of various persona in an organization.
We use three dashboards to report our KPIs.
CMO dashboard is used by C-level executives and contains high-level metrics that show the overall performance of our marketing campaigns.
Sales Manager dashboard is used by managers and above and contains metrics that help them manage their teams.
Territory 360 dashboard is used by sales representatives and contains metrics that help them manage their individual territories.
CMO Dashboard: This dashboard is designed to provide a high-level overview of the marketing performance to the CMO and other C-level executives. It includes key metrics such as Share of Voice, PR Impressions, Brand Awareness Surveys, Website Visits, Total Form Conversions, Unique Interactions, Leads, Oppty, Pipeline Revenue, New Logos Added, Customer Satisfaction Ratio, and Client Churn. This dashboard is updated monthly to ensure the CMO has a clear picture of the performance and can make informed decisions about future marketing strategies.
Awareness:
Share of Voice: The percentage of conversations in a particular market or industry that mention a brand or company. This helps to determine brand awareness and how a brand or company is perceived compared to competitors.
PR Impressions: The total number of views or impressions that a brand or company receives through media coverage. This helps to determine the reach and impact of a company’s PR efforts.
Discovery:
Website Visits: The number of times people visit a website. This helps to determine the effectiveness of a company’s website as a marketing tool.
Total Form Conversions: The total number of times people complete a form on a website. This helps to determine the effectiveness of a company’s lead generation efforts.
% Form Conversions to Visits: The percentage of website visits that result in a form conversion. This helps to determine the conversion rate of website visitors into leads.
Consideration:
Unique Interactions: The total number of unique interactions (e.g., clicks, likes, shares, comments) that a brand or company receives on social media. This helps to determine the level of engagement with a company’s social media content.
% Unique Interactions to Oppty: The percentage of unique interactions on social media that result in a sales opportunity. This helps to determine the effectiveness of social media as a sales tool.
% C-Suite Interactions: The percentage of social media interactions that involve C-level executives. This helps to determine the level of engagement with high-level decision makers.
Leads & Pipeline:
Leads: The total number of people who have expressed interest in a company’s products or services. This helps to determine the effectiveness of a company’s lead generation efforts.
Oppty: The total number of qualified sales opportunities in a company’s pipeline. This helps to determine the likelihood of sales success.
Pipeline: The total value of all sales opportunities in a company’s pipeline. This helps to determine the overall health of a company’s sales pipeline.
Revenue: The total revenue generated from sales. This helps to determine the financial success of a company’s sales efforts.
Targets: The total number of sales targets set for a given period. This helps to determine the level of ambition and direction in a company’s sales efforts.
Forecast: The expected revenue to be generated from sales. This helps to determine the financial projections for a company’s sales efforts.
Customer Loyalty:
New Logos Added: The total number of new customers acquired within a given period. This helps to determine the effectiveness of a company’s customer acquisition efforts.
Customer Satisfaction Ratio: The percentage of customers who are satisfied with a company’s products or services. This helps to determine customer loyalty and retention.
Client Churn: The rate at which customers stop doing business with a company. This helps to determine the overall health of a company’s customer base.
Sales Manager Dashboard: The Sales Manager Dashboard is designed to provide a comprehensive view of the sales performance across regions, geos, countries, and related ones. The dashboard includes metrics related to leads, sales, and targets. Specifically, it provides insights into the number of leads generated in each region, the sales revenue generated in each geo, and the progress made towards achieving the sales targets in each country.
In addition to these core metrics, the dashboard also includes other important indicators of sales performance, such as the number of opportunities created, the average deal size, the conversion rate of leads to opportunities, and the win rate of opportunities. These metrics help sales managers track the progress of their teams and make data-driven decisions about resource allocation, strategy, and training.
By providing a detailed view of the sales performance across different levels of the organization, the Sales Manager Dashboard enables sales managers to identify areas for improvement and take corrective action promptly. The dashboard is updated weekly, ensuring that sales managers have up-to-date information to guide their decision-making.
Territory 360 Dashboard: This dashboard is designed for sales representatives to track their individual performance against their targets. It includes metrics such as Leads, Oppty, Pipeline Revenue, New Logos Added, and Customer Satisfaction Ratio. The Territory Dashboard is updated daily, ensuring that the sales reps have up-to-date information on their performance and can take corrective action as needed.
Overall, these three dashboards work together to provide a comprehensive view of marketing and sales performance at various levels of the organization, enabling data-driven decision-making and continuous improvement.
Contact us
To find out how Ngenux can help you keep ahead in Marketing Analytics, contact us at connect@ngenux.com and have an educated discussion with our experts.”